| INVESTOR PRESENTATION MARCH 2019 |
| SAFE HARBOR STATEMENT This presentation is for informational purposes only and is not an offer to sell securities or a solicitation of an offer to buy any securities, and may not be relied upon in connection with the purchase or sale of any security. Sales and offers to sell Wayside Technology Group, Inc. securities will only be made in accordance with the Securities Act of 1933, as amended, and applicable Securities and Exchange Commission (“SEC”) regulations, including the written prospectus requirements. This presentation is proprietary and is intended solely for the information of the persons to whom it is presented. It may not be retained, reproduced or distributed, in whole or in part, by any means (including electronic) without the prior written consent of Wayside Technology Group, Inc.. This presentation may contain "forward-looking statements" within the meaning of Section 27A of the Securities Act of 1933 and Section 21E of the Securities Exchange Act of 1934. All statements, other than statements of historical fact, in this release that address activities, events or developments which we expect will or may occur in the future are forward-looking statements, including statements regarding the intent, belief or current expectations of the Company and members of our management team. The words "will," "believe," "intend," "expect," "anticipate," "project," "estimate," "predict" and similar expressions are also intended to identify forward-looking statements, including those regarding guidance on future financial results; expectations concerning market opportunities and our ability to capitalize on them; and the amount and timing of the benefits expected from acquisitions, new products or services and other potential sources of additional revenue. Such forward-looking statements are not guarantees of future performance and involve risks and uncertainties. These risks and uncertainties include, but are not limited to, those relating to: market acceptance of our products and services, relationships with customers and vendors, strategic partners and employees; difficulties in integrating acquired businesses; changes in economic or regulatory conditions or other trends affecting the Information technology industry; and other matters included in our SEC filings, including in our Annual Report on Form 10-K. Actual results may differ materially from those contemplated by the forward-looking statements. We undertake no obligation to update our forward-looking statements to reflect future events or circumstances. In addition to U.S. GAAP financials, this presentation includes certain non-GAAP financial measures. These non-GAAP financial measures are in addition to, and not a substitute for or superior to, measures of financial performance prepared in accordance with U.S. GAAP. A presentation of and reconciliation to the most directly comparable GAAP financial measure, where such can be done without unreasonable effort, can be found in the appendix to this presentation or on our Web site at www.waysidetechnology.com/investor. This presentation contains statistical data that we obtained from industry publications and reports generated by third parties. Although industry publications and surveys generally state that the information contained therein has been obtained from sources believed to be reliable, we have not independently verified this statistical data. 2 |
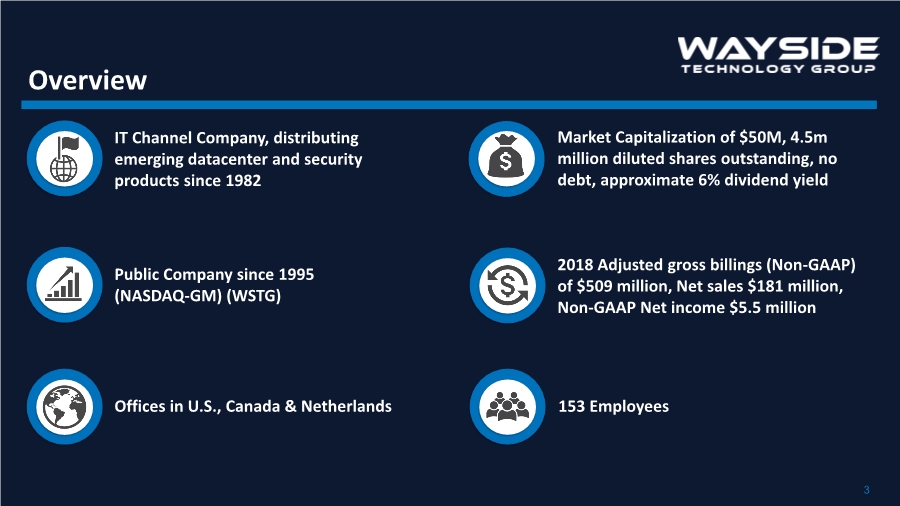
| Market Capitalization of $50M, 4.5m million diluted shares outstanding, no debt, approximate 6% dividend yield IT Channel Company, distributing emerging datacenter and security products since 1982 Offices in U.S., Canada & Netherlands Public Company since 1995 (NASDAQ-GM) (WSTG) 2018 Adjusted gross billings (Non-GAAP) of $509 million, Net sales $181 million, Non-GAAP Net income $5.5 million 153 Employees Overview 3 |
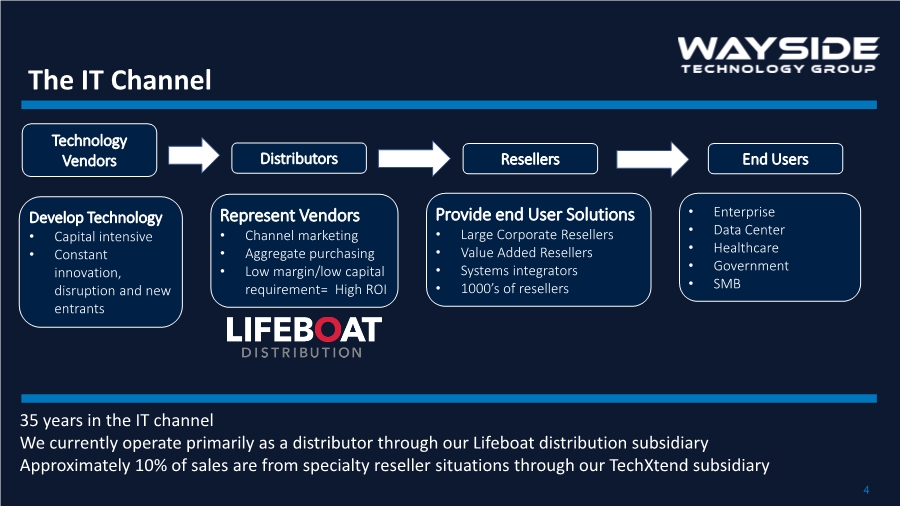
| Technology Vendors The IT Channel Distributors Resellers End Users 35 years in the IT channel We currently operate primarily as a distributor through our Lifeboat distribution subsidiary Approximately 10% of sales are from specialty reseller situations through our TechXtend subsidiary Develop Technology • Capital intensive • Constant innovation, disruption and new entrants Represent Vendors • Channel marketing • Aggregate purchasing • Low margin/low capital requirement= High ROI Provide end User Solutions • Large Corporate Resellers • Value Added Resellers • Systems integrators • 1000’s of resellers • Enterprise • Data Center • Healthcare • Government • SMB 4 |
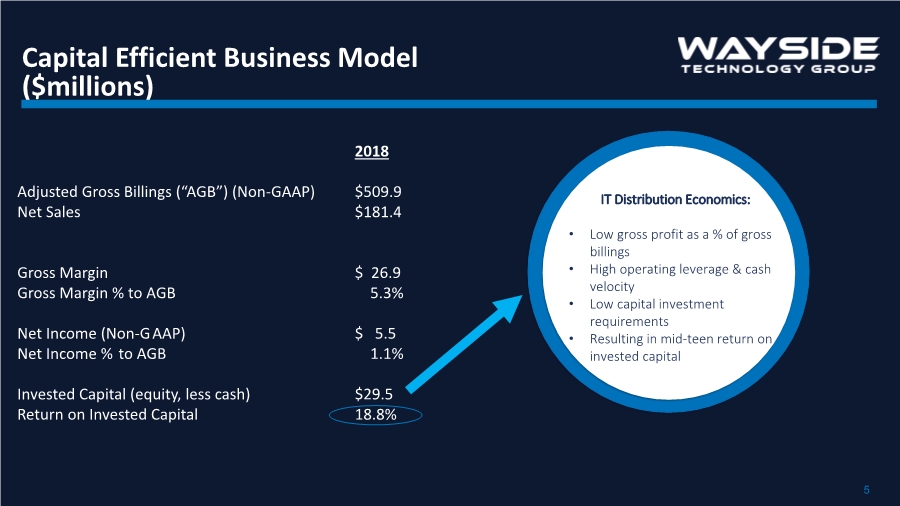
| 5 Capital Efficient Business Model ($millions) IT Distribution Economics: • Low gross profit as a % of gross billings • High operating leverage & cash velocity • Low capital investment requirements • Resulting in mid-teen return on invested capital 2018 Adjusted Gross Billings (“AGB”) (Non-GAAP) $509.9 Net Sales $181.4 Gross Margin $ 26.9 Gross Margin % to AGB 5.3% Net Income (Non-GAAP) $ 5.5 Net Income % to AGB 1.1% Invested Capital (equity, less cash) $29.5 Return on Invested Capital 18.8% |
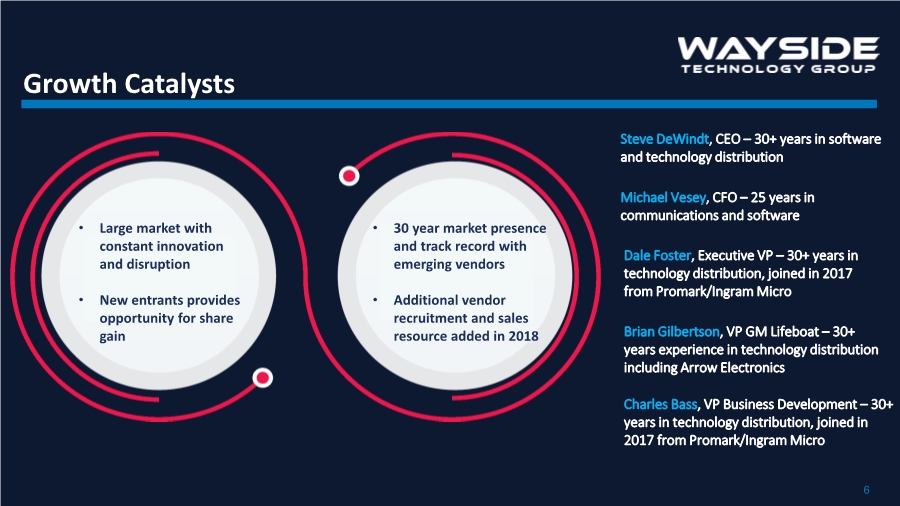
| 6 Growth Catalysts • Large market with constant innovation and disruption • New entrants provides opportunity for share gain Steve DeWindt, CEO – 30+ years in software and technology distribution Michael Vesey, CFO – 25 years in communications and software Dale Foster, Executive VP – 30+ years in technology distribution, joined in 2017 from Promark/Ingram Micro Brian Gilbertson, VP GM Lifeboat – 30+ years experience in technology distribution including Arrow Electronics Charles Bass, VP Business Development – 30+ years in technology distribution, joined in 2017 from Promark/Ingram Micro • 30 year market presence and track record with emerging vendors • Additional vendor recruitment and sales resource added in 2018 |
| IT’s our DNA |
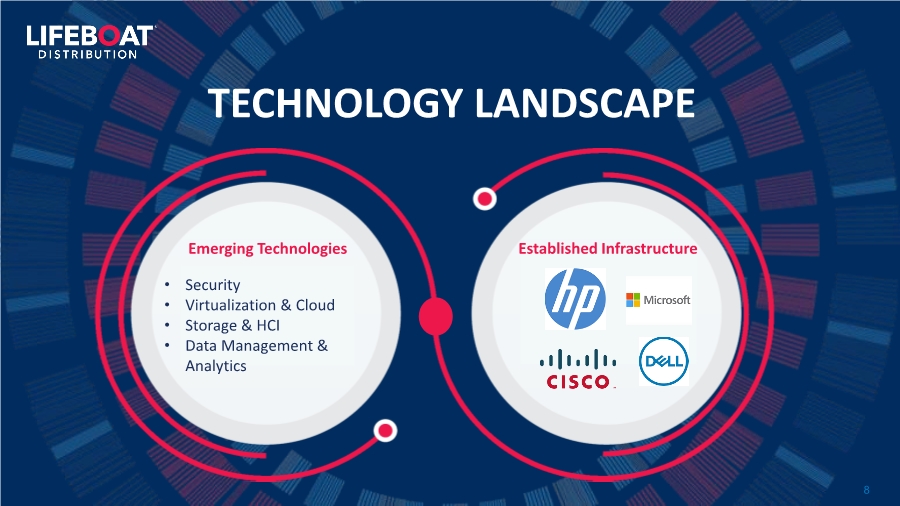
| Emerging Technologies Established Infrastructure TECHNOLOGY LANDSCAPE • Security • Virtualization & Cloud • Storage & HCI • Data Management & Analytics 8 |
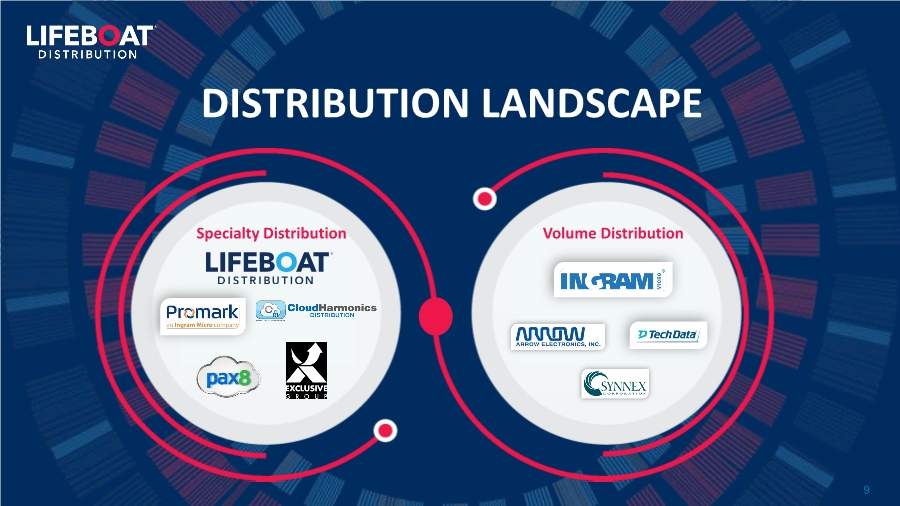
| Specialty Distribution Volume Distribution DISTRIBUTION LANDSCAPE 9 |
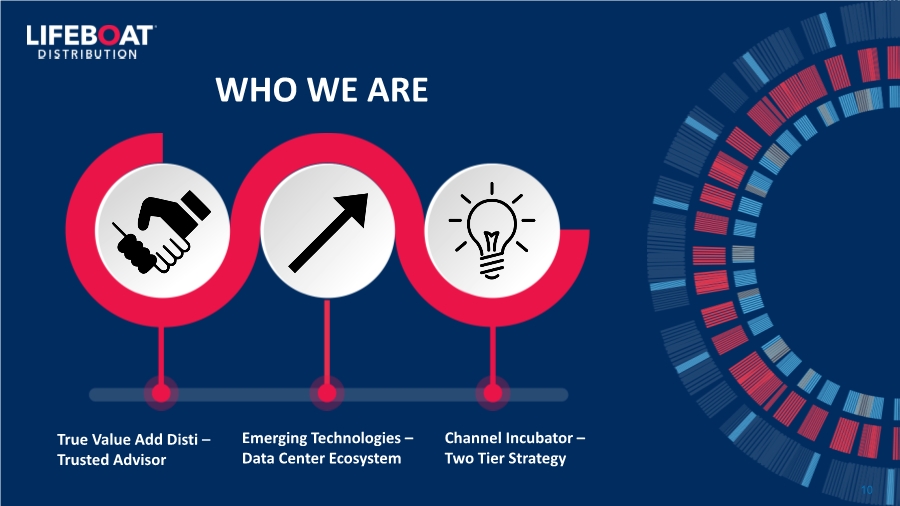
| WHO WE ARE Channel Incubator – Two Tier Strategy Emerging Technologies – Data Center Ecosystem True Value Add Disti – Trusted Advisor 10 |
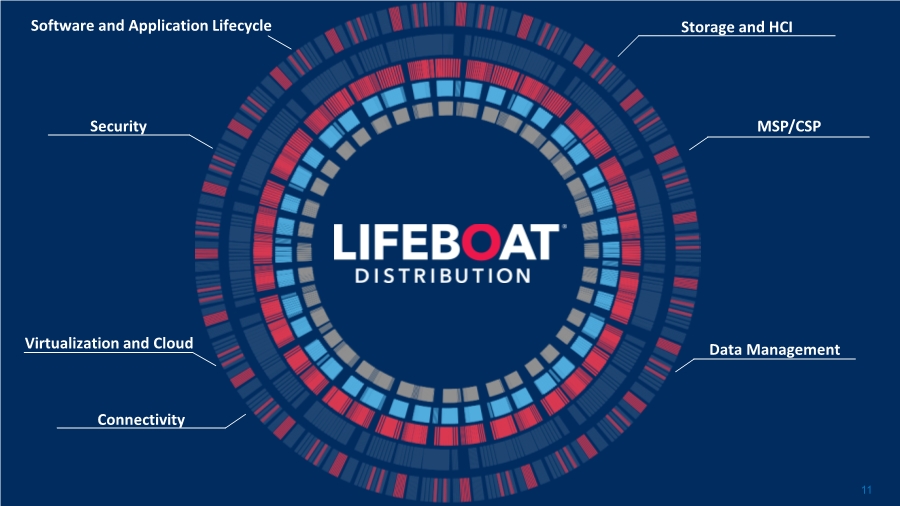
| Security Virtualization and Cloud Connectivity Data Management Storage and HCI MSP/CSP Software and Application Lifecycle 11 |
| Software and Application Lifecycle Solutions for Dev Ops, ALM & ADLM environments as well as Business Intelligence, Business Productivity AI, IoT, and other IT trends 12 |
| Cyber and Network Security Solutions from multiple industry-leading suppliers that encompass the entire environment from edge to endpoint. 13 |
| Virtualization and Cloud Solutions for server consolidation and containment, development and test optimization, business continuity and disaster recovery, and desktop manageability and security. 14 |
| Tools to proactively secure, manage and monitor the network. Meet the real-world needs of the always- on data center. Connectivity 15 |
| HCI and Storage Solutions for software-defined storage, networking, virtualization, and disaster recovery. Bringing together computing resources, storage and networking to reduce compatibility issues and total cost of ownership. 16 |
| Data Management Solutions that go beyond disaster recovery and business continuity planning. Deliver the right level of compliance and protection; resolve a wide variety of possible IT disasters. 17 |
| MSP/CSP 600+ active MSP/CSP’s and growing Currently developing MSP/CSP marketplace on lifeboatdistribution.com Rapidly growing vendor participation 18 |
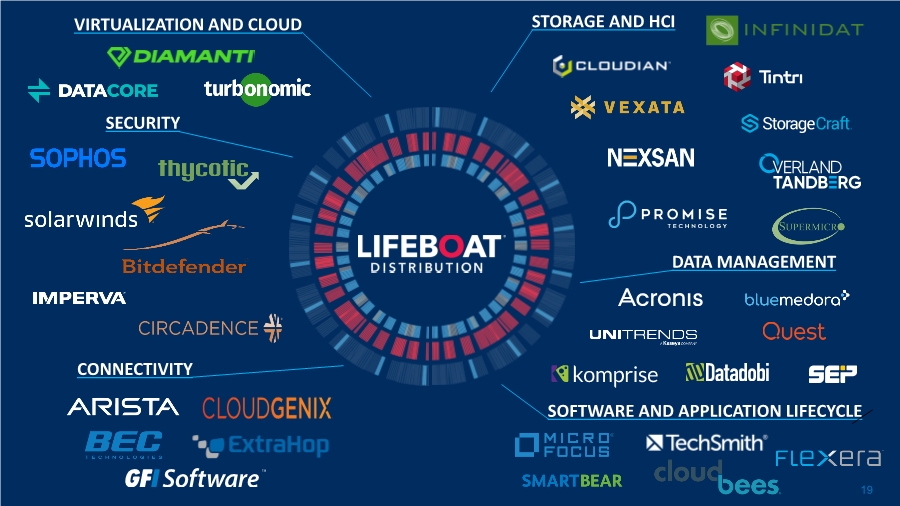
| SECURITY DATA MANAGEMENT SOFTWARE AND APPLICATION LIFECYCLE VIRTUALIZATION AND CLOUD STORAGE AND HCI CONNECTIVITY 19 |
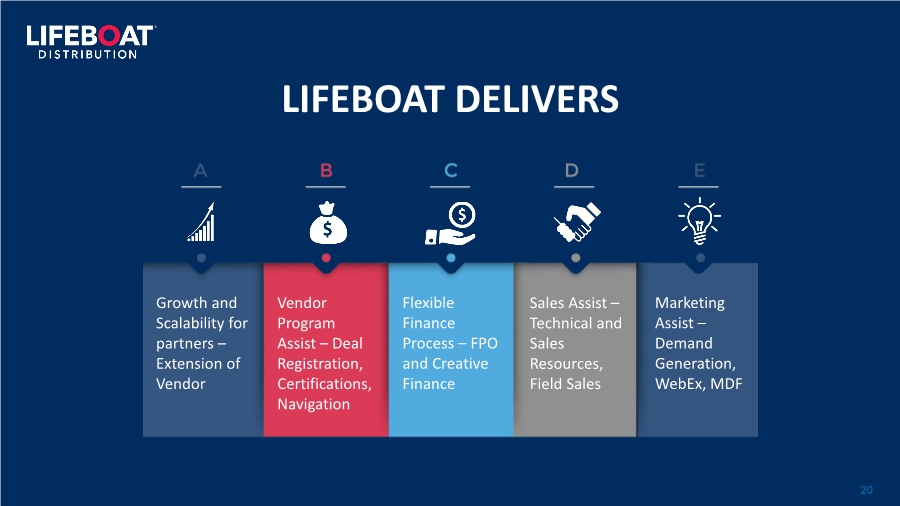
| LIFEBOAT DELIVERS Growth and Scalability for partners – Extension of Vendor Marketing Assist – Demand Generation, WebEx, MDF Sales Assist – Technical and Sales Resources, Field Sales Flexible Finance Process – FPO and Creative Finance Vendor Program Assist – Deal Registration, Certifications, Navigation 20 |
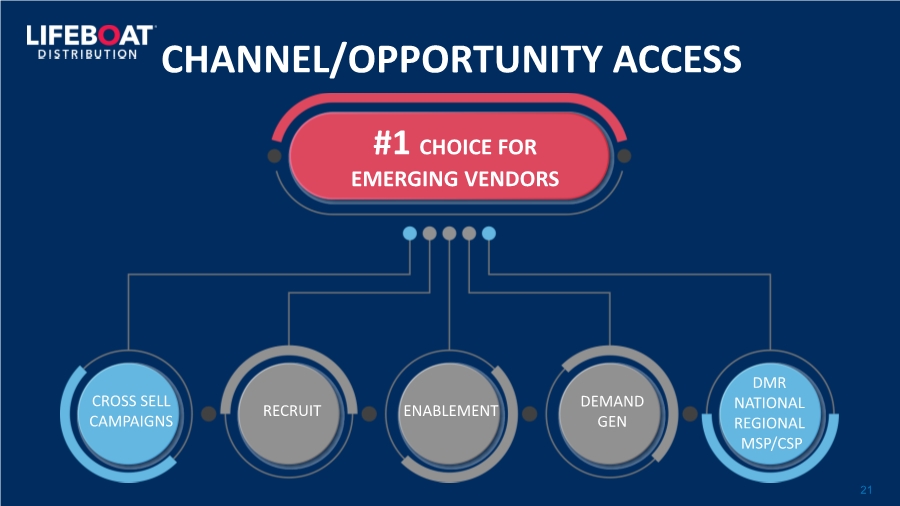
| #1 CHOICE FOR EMERGING VENDORS CROSS SELL CAMPAIGNS DMR NATIONAL REGIONAL MSP/CSP RECRUIT ENABLEMENT DEMAND GEN CHANNEL/OPPORTUNITY ACCESS 21 |
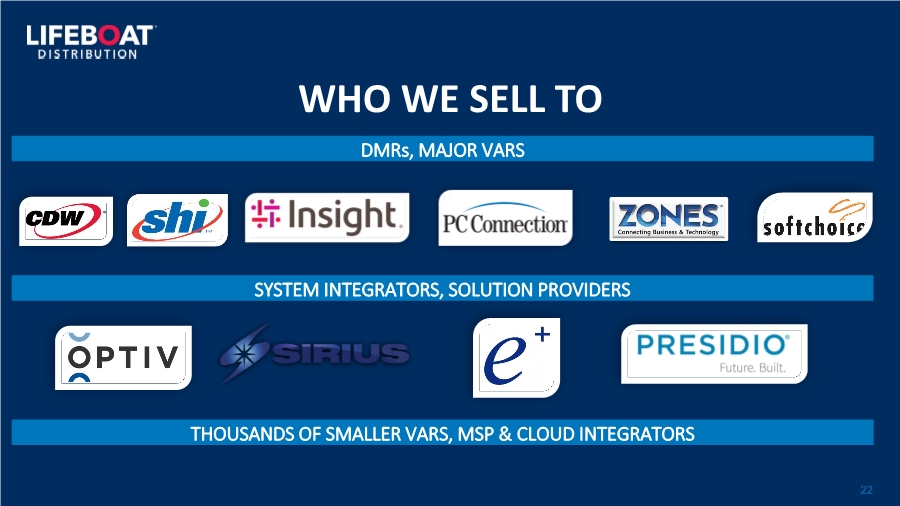
| WHO WE SELL TO SYSTEM INTEGRATORS, SOLUTION PROVIDERS THOUSANDS OF SMALLER VARS, MSP & CLOUD INTEGRATORS DMRs, MAJOR VARS 22 |
| 23 FINANCIAL INFORMATION |
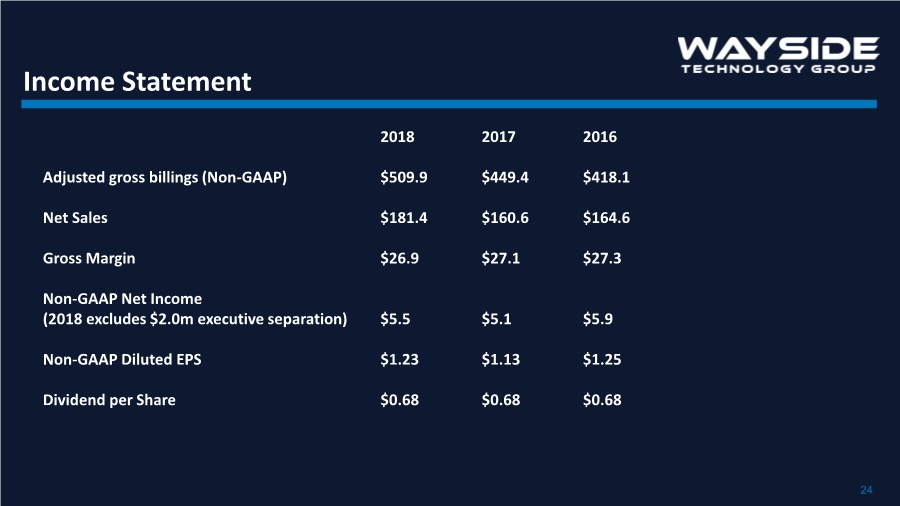
| 24 Income Statement 2018 2017 2016 Adjusted gross billings (Non-GAAP) $509.9 $449.4 $418.1 Net Sales $181.4 $160.6 $164.6 Gross Margin $26.9 $27.1 $27.3 Non-GAAP Net Income (2018 excludes $2.0m executive separation) $5.5 $5.1 $5.9 Non-GAAP Diluted EPS $1.23 $1.13 $1.25 Dividend per Share $0.68 $0.68 $0.68 |
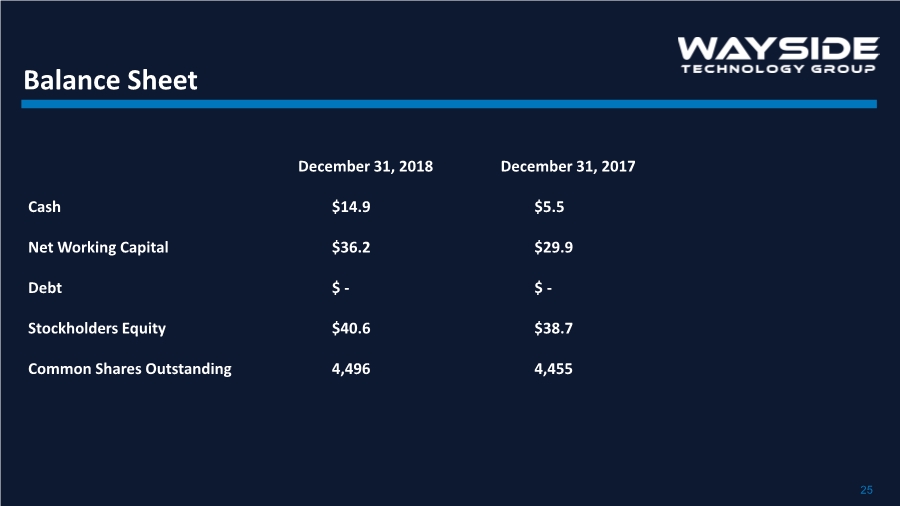
| 25 Balance Sheet December 31, 2018 December 31, 2017 Cash $14.9 $5.5 Net Working Capital $36.2 $29.9 Debt $ - $ - Stockholders Equity $40.6 $38.7 Common Shares Outstanding 4,496 4,455 |
| 26 Questions |
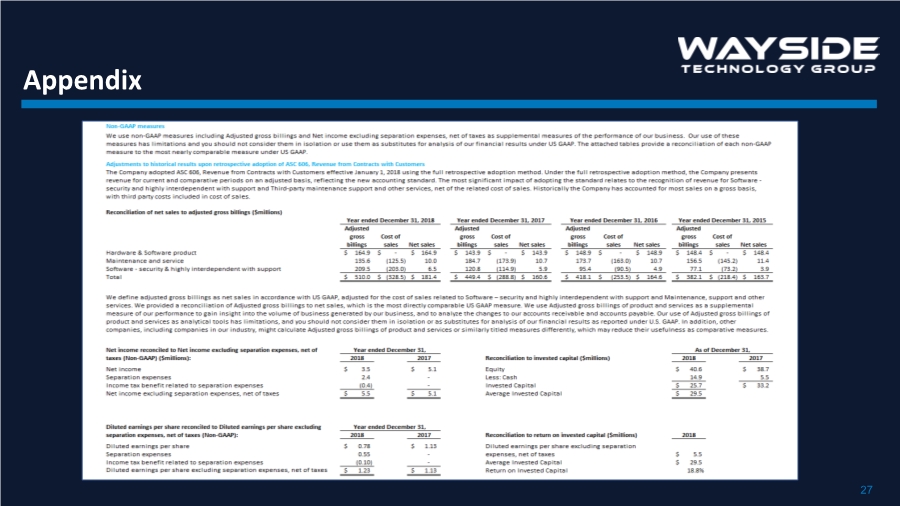
| 27 Appendix |